Why trade Emini’s ?
The Eminis are an extremely technical market. Technical markets usually mean that they are easier to forecast and trade in a purer sense of the word. Eminis are immune to large gaps and single company news events. The less volatile the market is for fundamental reasons, the better it is for highly technical approaches to trading.
Low commissions, exchange transparency, large volume, technical markets, low margins etc attract lot of retails players to Emini market. Stocks, bonds, options, forex, none of these markets compare with emini trading when all the factors are taken into account.
Who are the other players ?
Understanding the other players involved in the market is paramount in trading any market. As a retail trader, we are the weakest link in the market. Usually other players profit from retail players like us. Most inexperienced retail traders with minimal capital wont last more than 6 months in the market.
Other time frame players are Institutions and Managed funds with enormous capital and expertise. As the weakest link, a retail player should try to identify their move and ride along.
Locals are pit traders who facilitate large volume trades between buyers and sellers. They handle large volumes and provide liquidity to the Market.
How does Market work ?
Read this to get some basic understanding on Market Auction Process.
How to trade Emini’s ?
My approach is a blend of Market Profile and Volume and Price action. Use a three time-frame chart( weekly, daily and 30 or 60min) to understand the main trend in the market. Identify corrections and trend continuation so that you will always have a view of the bigger picture.
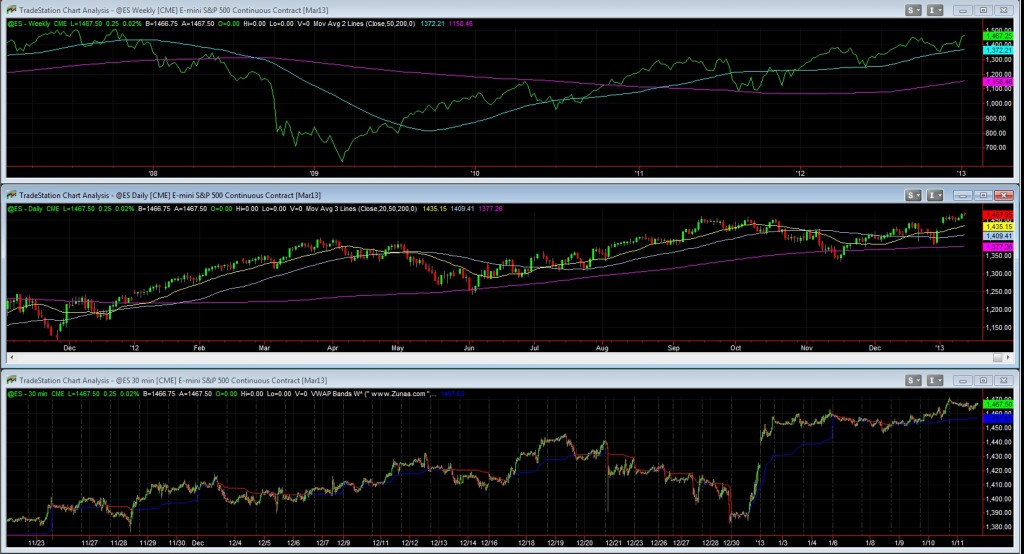
3 time-frame chart
Value is the fair price where buyers and sellers agree or are equal strength. Price oscillation is the process of discovering value. Once a price is accepted at a certain level, value is established. Market is not static, depending on the stimulus, price will start moving again exploring new value areas.
I use Market Profile and Volume distribution for identifying Value.
Market Profile uses TPO’s (Time Price Opportunity) to identify Value and Value Area. A price with most number of TPO’s is called Point of Control (POC). The area where 70% of TPO’s are present defines Value Area (VA), bordered by Value High and Value Low. Please note TPO chart may be applied to any duration (daily weekly etc). A weekly chart will provide weekly POC and VA while daily chart will provide daily POC and VA.
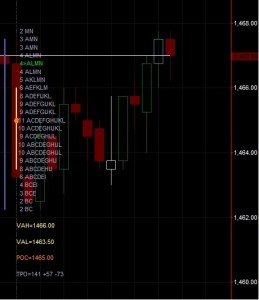
Market Profile TPO chart
Volume Distribution plots volume traded at every price level. The price where largest volume traded is called Volume Point of Control (VPOC). A price where equal amount of volume traded above and below it is called Volume Waited Average Price (VWAP). If you take one standard deviation from VWAP, it will identify the area where 70% of the volume traded. This zone is identified as the Value Area based on Volume.
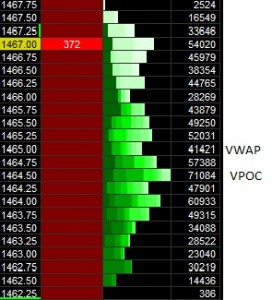
Volume Distribution with VPOC and VWAP
Markets in Profile and Mind Over Markets are good reference for learning more about Market Profile.
Trading Logic: Markets are in constant discovery of Value. Market may be in Trend or Range depending on the external stimuli like prevailing economic conditions, job growth, housing market etc etc. Again your view of the Market will depend on your time-frame as a trader. If you are in it for longer term, you are not concerned about the intra-day ups and downs as much as an intra-day trader.
If price moves away from Value to either extreme, it has to get accepted there or price will fall back to the currently accepted value area. By price acceptance, in a day time-frame, implies 4 or more TPO’s at a particular price.
During the price traversal of exploring and re-defining value, price may pause and continue or reverse at certain levels. These levels are called Support/Resistance (SR Level). Support and resistance levels may be formed by any number of factors like previous days high/low, Initial Balance, Single Print zones, whole numbers etc etc.
As a trader it is your job to identify SR levels and monitor how price behaves at that level. When a price level has a confluence of indicators (multiple SR parameters intersect ), that level makes a high probability area. Combine this with bias of the market, you may enter a high probability trade in the direction of the trend or price movement. All of these put together defines the Market Context for executing a high probability trade.
Learning to trade the right way will take lot of time and effort. If you cannot commit the time and effort, it is better not to trade with real money. Open a simulated account and practice until you are confident. Even with the simulated account, perform the context check with every trade and make sure you have a valid reason to enter that trade and why you thought it was a high probability one. Keep a journal of all the trades, review and learn from your own mistakes !!.