When buyers or sellers flex their muscle, this may be identified via the value area range extensions, in the form of initiative or responsive activity. Identifying these range extensions and how price behave next day with regards to the range extension will give some idea about market strength and direction.
For making this simple, we consider range extensions after IB period to identify initiative activity. For example if price breaks out of IB High and close above it for the day, this may be classified as Initiative Buying Range extension (IBRE). Similarly if price breaks below IB and close below IB Low for the day, it may be classified as Initiative Selling Range Extension (ISRE). Both are Initiative activity by buyers and sellers.
Once IBRE or IBSE is established, watch price behaves next day. Days strength may be assessed based on where it opens and how the range extensions are held. A poke below these levels will indicate weakness.
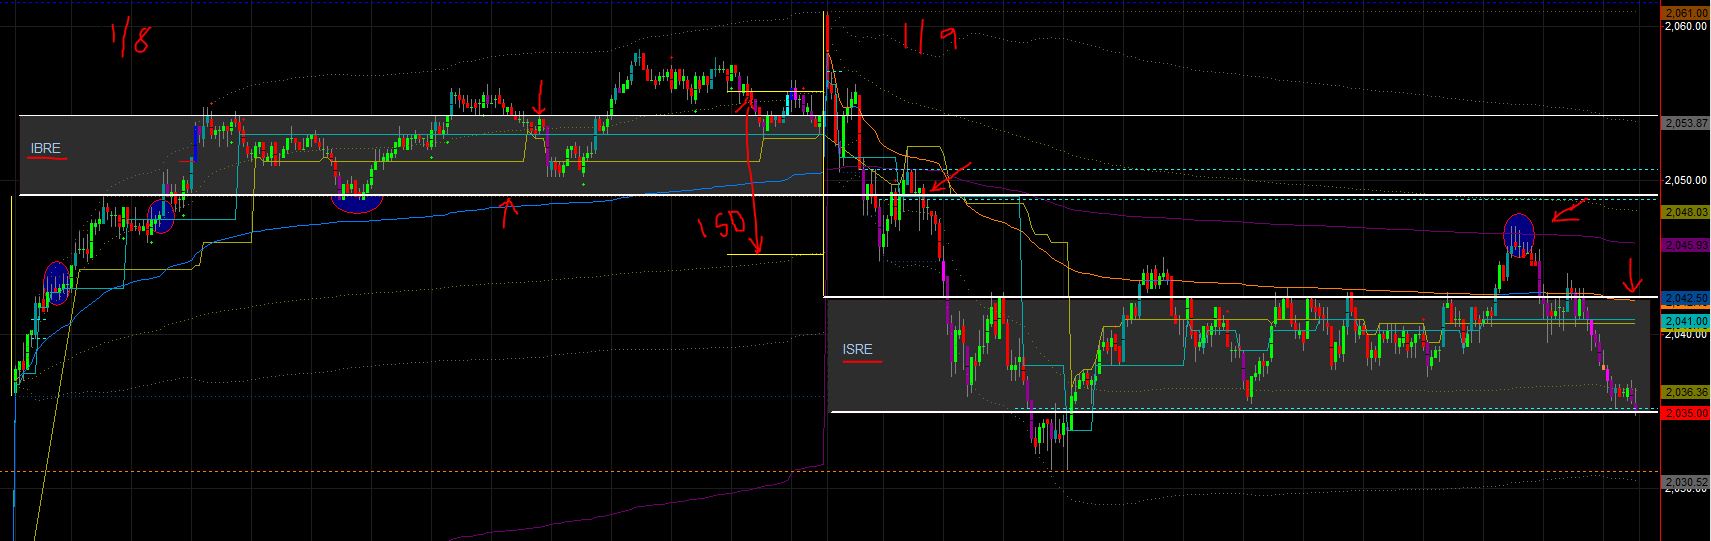
Consider an example from 01/08/2015 and 01/09/2015.
On o1/o8 Price moved above IB High and established IBRE. 2049 is the IB High and if the Initiative buying activity to continue, price should hold this level.
On 01/09 Price opened above IBRE range but quickly reversed. Price poked below 2049 in good volume and pulled back above it. If price was able to bounce higher from this level, it would trigger a long signal. Instead price closed below it triggering a short signal.
01/09 established ISRE range by closing below IB Low. This levels are important for gauging market strength and direction for Monday Jan 12th.
Please note, this may not be used as a primary indicator / level for taking trades. But should be used as a directive or supporting indicator to supplement other strategies.
1/9 opened with multiple other indicators revealing the weakness in the market
1) Spreads GAP down at open indicating weakness at open. Highs where not supported by breadth of stocks.
2) IB range engulfed One standard deviation from previous day. 1 SD covers 70% of volume traded. If price was able to slice thru this, that shows resolve from the part of sellers to go lower.
Initiative activity by buyers and sellers.
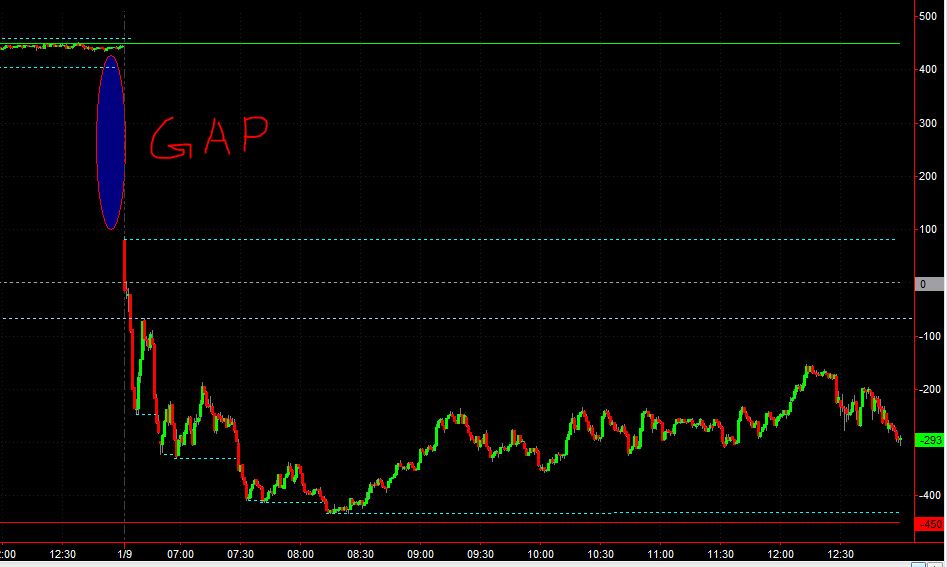
Spreads GAP lower indicating weakness at Open on 01/09.