Normal Days under Market Profile are characterized by wide Initial Balance. Average width of IB for Normal day is around 10 points for ES. The IB High and IB Low will mark the high and low for the day, with price oscillating between these extremes. Even thou these day types are called Normal, they are not very common, occurs very rarely. Normally some news or events will propel the market in one direction and once buying / selling is cut off , price will start reverse course.
Characteristics: Wide IB of around 10 points for ES. IBH and IBL mark the day’s high and low. Below average volume.
How to trade Normal Days : Once a day type is identified as Normal, a good way to trade is to fade the extremes.
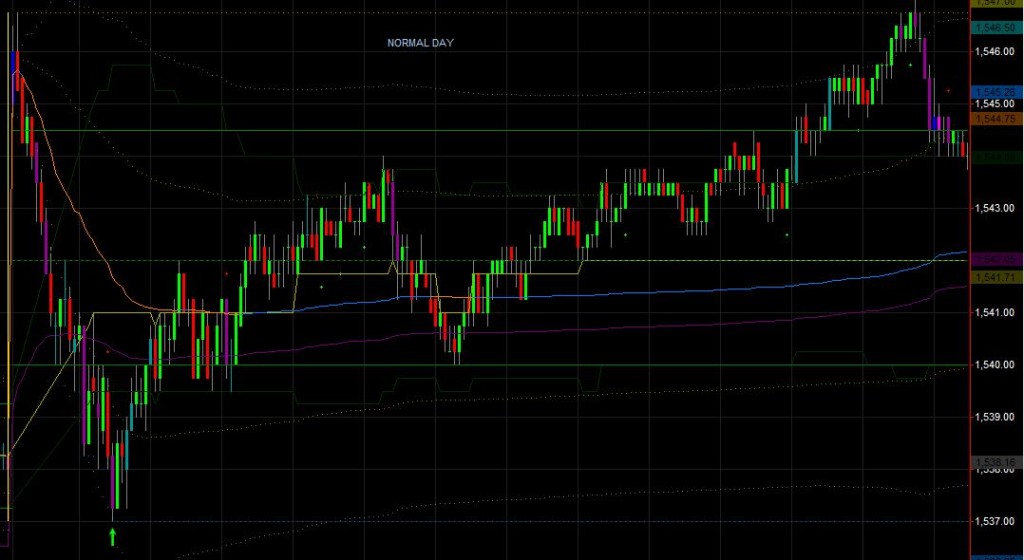
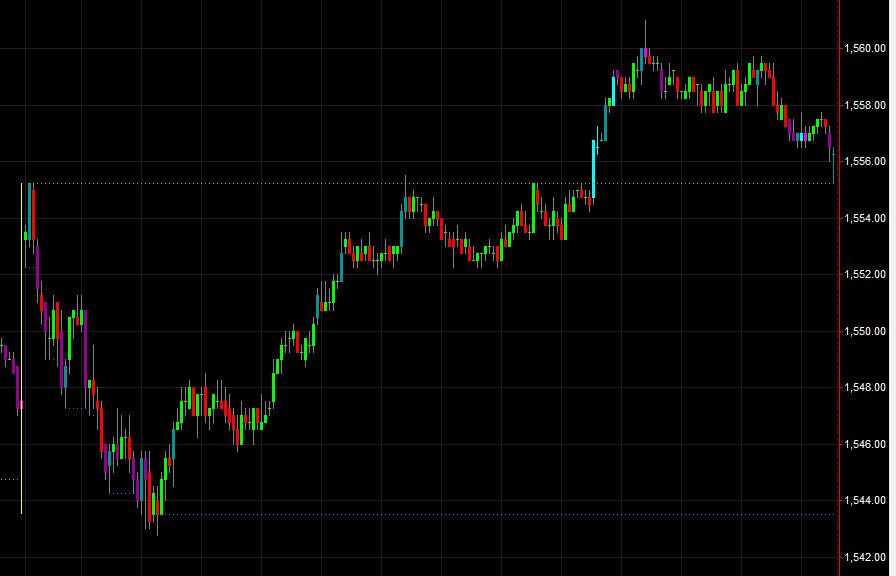
Normal Day with Wide IB
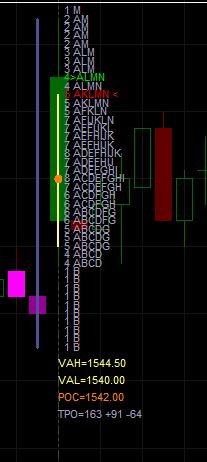
Normal Day Price Profile
Below is the $TICK for a Normal Day. Notice how balanced the TICKS where around the ZERO line.
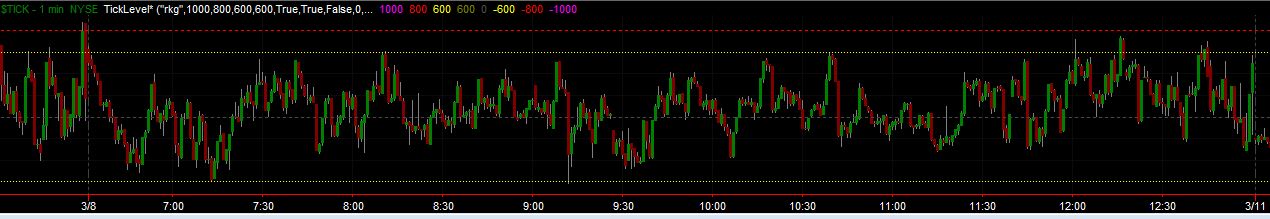
Normal Day Ticks
Spreads also made a nice smooth uptrend once price reversed at IB Low.
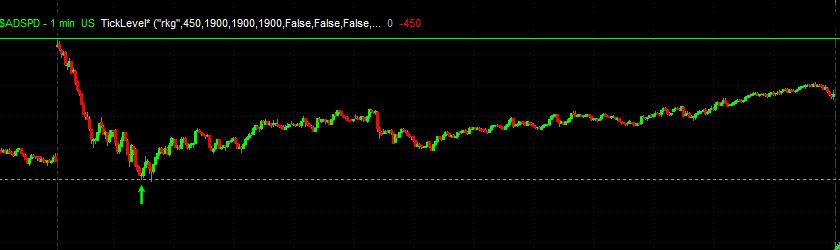
Normal Day Spreads
How to differentiate a Normal Day from Trend Day or Normal Variation of Normal Day ?
Both Trend Day and Normal variation of Normal Day have wide IB. A trend day will have $TICKS staying above or below ZERO based on an uptrend or down trend. Normal variation of Normal Day is bit more tricky to identify as fading the extremes may backfire on such a day.
Consider the below example. IB range is around 12 points on ES, which qualifies it as a Normal Day. Price got rejected at IB LOW and reversed. A natural tendency is to fade the IB High, if the day is classified as Normal Day. But during the reversal, $TICK mostly stayed above ZERO indicating strong buying pressure. This should serve as an early warning for IB high breakout and the possibility for a Normal Variation day.
Normal Variation of Normal Day. Wide IB may cause classifying it as Normal Day during the morning session.
Monitoring $TICKS revealed the buying pressure during the uptrend. This pointed to the possibility of an upside IB breakout. Notice all the pullbacks from IB was very shallow, even-thou some candles have a long upper shadow indicating a bearish bias. Using $TICKS to confirm the price action will help identify false pullbacks and breakouts.
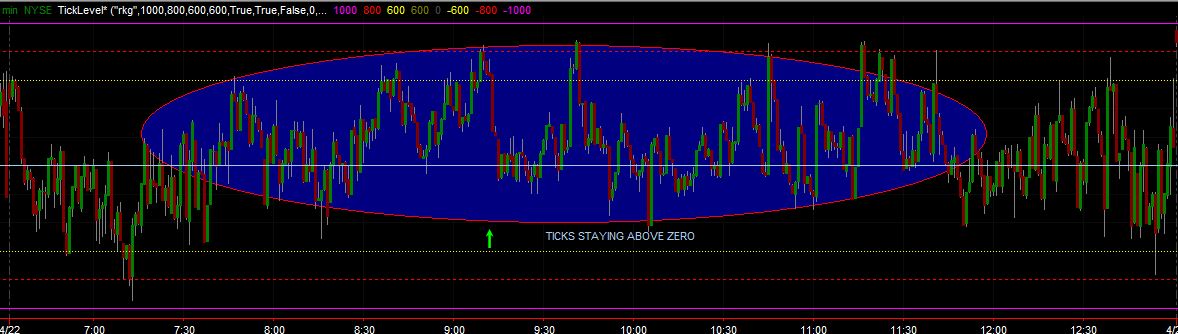
$TICKS stayed above ZERO during the uptrend. All the pullbacks from IB were very shallow, pointing to a possible IBH breakout.